Funny graphs - from GraphJam
By Murray Bourne, 31 Jan 2011
GraphJam uses pie charts, histograms and Venn diagrams to give us some really funny insights into the human condition.
Here is a sampling of their more family-friendly graphs:
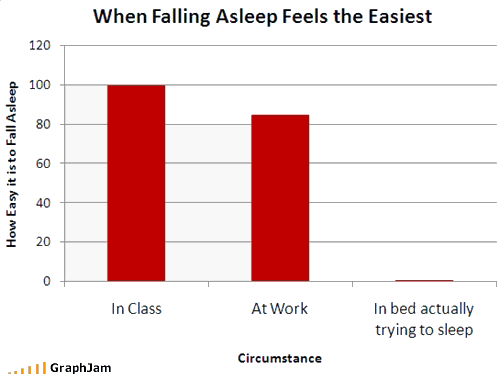
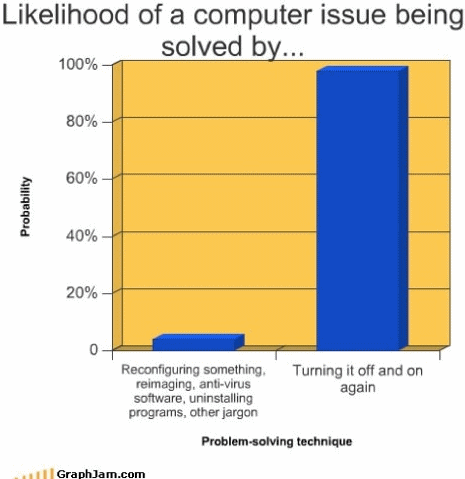
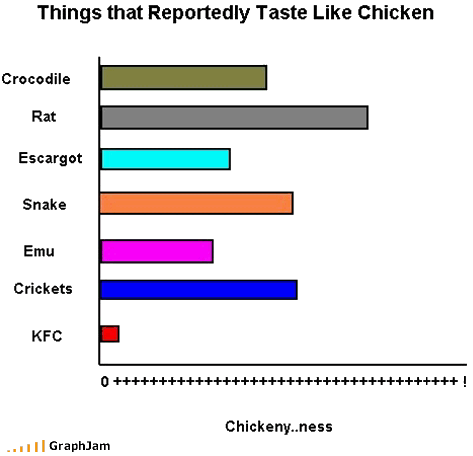



What GraphJam is doing in these graphs could be a great concept for a class project in statistics - to encourage students to be creative (almost always missing in math classes), have fun making others laugh, and learn something about expressing statistics in a visual way.
I'll feature some more of these graphs in a later article.
Disclaimer: GraphJam is not always a family-friendly site. With that in mind, here is their link: Graphjam.
See the 3 Comments below.

11 Feb 2011 at 11:07 pm [Comment permalink]
interesting graphs.good way to love math
12 Feb 2011 at 4:43 pm [Comment permalink]
So simple yet true.Did make it look interesting for even those who hate Maths.
18 May 2011 at 2:32 am [Comment permalink]
[...] out some funny graphs at GraphJam. Go and check it [...]