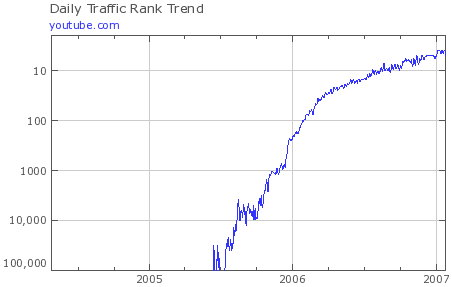
Interesting semi-logarithmic graph - YouTube Traffic Rank
By Murray Bourne, 25 Jan 2007
The growth in popularity of YouTube has been extraordinary. It has gone from an unknown, unheard-of site (not even in the top 100,000 sites, so off the scale) to the 5th highest ranked site on the Web, all in the space of 18 months.
This image, from Alexa, is an interesting example of a semi-logarithmic graph. The vertical scale (traffic rank) is logarithmic, while the horizontal scale (time) is linear.

See the 7 Comments below.

27 Jan 2007 at 9:43 am [Comment permalink]
I love this example of the use of a semilog graph to emphasize the area of greatest interest in a ranking situation and will be using it in my precalculus class a week or so from now. I can also imagine that a loglog graph might be useful to get a view of high frequency small amplitude oscillations near the origin and/or big slow variations far away, but would be hard put to come up with such a topical example. Of course a loglog graph is also very useful for identifying a power law (which it converts to a straight line) and I would like to suggest that showing an example of this (perhaps with a non-integer exponent) might be a worthwhile addition to your page - especially since the loglog transformation of an exponential (which you demonstrate) is again an exponential so the only effect in that case is an overall scaling.
cheers,
Alan
27 Jan 2007 at 9:45 am [Comment permalink]
Thanks Alan for your suggestion, which I have implemented at Log-log and Semi-log Graphs.
BTW - I like your domain name! Very clever.
28 Jan 2007 at 1:31 pm [Comment permalink]
Yeh, thanks Zac. It's a really interesting graph. I remember the semi-log graph from school days, but we never had examples like this.
29 Jan 2007 at 4:30 pm [Comment permalink]
One of the important questions is: why?
In this case, why did YouTube enjoy this tremendous growth?
The reason is the "force" that lies beyond much of social networking (MySpace) , part of Google's rise, and Windows/office domination. It's network effects. The more people are in such a network, the more the network is desirable. Further more, if one is comparing two such networks, their size is an important consideration.
Thus, we can think of the network as accelerating and not growing at a constant speed. A good exercise for students is to graph various such networks and compare the graphs and deduce the strength of the network effect.
30 Jan 2007 at 3:26 am [Comment permalink]
Ah yes, Moti - you have nailed Web 2.0 on the head.
The social networking force has many implications for institutions of learning. The old education model may have a limited lifespan...
30 Aug 2010 at 7:23 pm [Comment permalink]
This Graph is incorrect it is actually showing a decline rather than a rise the values along the Y-axis are decreasing as we go up, so according to the graph You-tube had most traffic in mid 2005 and it has been declining ever since. Which seriously can n't be true.
30 Aug 2010 at 8:16 pm [Comment permalink]
Hi Hardy. The vertical axis scale is the traffic rank (as opposed to traffic amount), where the top ranking site has rank 1.
The graph is correct!