Many Eyes: Browsing Visualizations
By Murray Bourne, 24 Apr 2007
UPDATE: IBM closed down this service on 15 Jun 2015. Nothing is forever.
Browsing Visualizations is an interesting site from IBM.
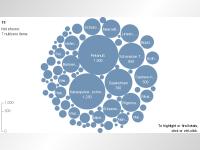
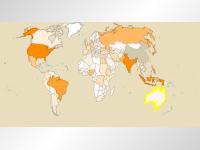
You can see data sets displayed in several different ways, including information superimposed on a world map, bubble plots and tag clouds.
Topics for the visualizations range from population density and growth, state killings of the 20th century, free trade, amount of nickel in food, age of founders of high tech companies, and so on.
From their About page:
Many Eyes is a bet on the power of human visual intelligence to find patterns. Our goal is to "democratize" visualization and to enable a new social kind of data analysis.
The visualization is Java-based and therefore can be a bit slow to load. But it is worth the wait.
In true Web 2.0 fashion, users provide the data and create the visualization.
So I thought I better do one. I uploaded usage statistics for the e-learning course that I am currently facilitating. There are 29 participants involved and their participation for the 1st to 23rd April is charted on a bubble plot (there are lots of "zero" participation entries in the middle).
Unfortunately, however, they subsequently deleted my efforts...
Since the data supplied to Many Eyes is by users and not verified, you cannot be sure that what you see is true.
There are hundreds of visualizations in this site - certainly worth a look. And certainly worth uploading your own data and playing with it. They have made it very easy to add your own data. An impressive site.
See the 1 Comment below.
