Riemann Sums
By Murray Bourne, 14 Jun 2010
Integration is a process in mathematics that can tell us:
- The area of a curved 2-D object (the sides aren't straight, and there is no simple formula)
- The volume of a curved 3-D object (once again, the sides aren't straight)
- The velocity of an object if we know its acceleration at time t (which means the acceleration changes all the time, as does its velocity)
- The displacement of an object if we know its velocity at time t (the velocity and displacement change over time, so there is no simple formula)
- The pressure on an object deep under water (the pressure varies as we go down)
In integration we spend a lot of time talking about areas under curves because such areas can be used to represent any of the quantities given above.
Most of the time in math class we use integration to find the areas under curves. We are told the area under some curve f(x) can be found by finding the definite integral between certain lower and upper limits, a and b as follows:
![]()
However, it turns out that is not always possible to find such an integral.
Our Problem
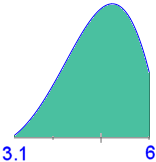
I need to find the area under the following curve, between x = 3.1 and x = 6.
![]()
The required area is shaded green in the following graph.
So we write the following integral to represent the required area:
![]()
However, it is not possible to find the above integral using normal algebraic integration.
What to do? Well, we need to find the result numerically, just like mathematicians had to do for all integrations before Isaac Newton and Gottfried Leibniz developed calculus in the 17th century.
One way of doing this is to draw a grid over the shaded area and then count the little squares:
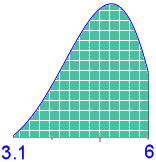
However, you can imagine this would get very tedious very quickly, especially if you had to find many such areas. And remember, if you want a more accurate approximation, you have to use smaller squares and that involves more counting.
There is a better way.
[Please note that what we are about to do is the way computers find integrals numerically.]
Riemann Sums
Riemann Sums give us a systematic way to find the area of a curved surface when we know the mathematical function for that curve. They are named after the mathematician Bernhard Riemann (pronounced "ree-man", since in German "ie" is pronounced "ee").
The following interactive javascript graph allows you to investigate the area under a simple parabola (y = x2). The actual area is also displayed for comparison.
In the following graph, you can change:
- The type of Riemann Sum at the top of the graph,
- The number of rectangles (or trapezoids) by dragging the slider,
- The start and end points of the graph, by dragging the sliders.
Simple Example
Update (May 2014): This applet has been updated, improved and moved, and you can now find it here: Riemann Sums.
Explanation
What you were doing above was as follows.
We can form equal width rectangles between the start and end points of the area we need to find.
If we add up the areas of the rectangles, we will have a good approximation for the area.
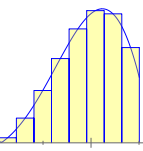
We can either place the rectangles so the curve is on the left or right as follows. Depending on the curve one or the other gives a reasonable approximation.
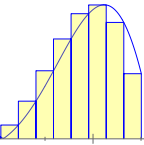
You can see in the above examples, the "left" approximation will be too small (the sum of the rectangle areas is less than the area below the curve), while the "right" one will be too large.
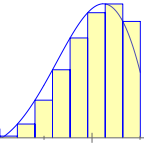
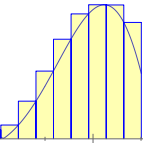
Another, and better option is to place the rectangles so the curve passes through the mid-points of each rectangle, as follows:
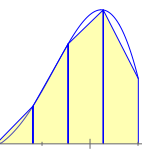
Another option is to create trapezoids. When the number of trapezoids is very high, they cover nearly all of the area under the curve.
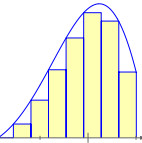
The final 2 options we can use are lower (where the rectangles are completely below the curve) and upper (where the rectangles are completely above the curve).
The Solution to Our Problem
Earlier, we wanted to find the area under the curve y = |0.3x3 sin x| between x = 3.1 and x = 6.
You can use the following interactive graph to find the answer using Riemann Sums.
Choose Riemann sum type:
You can see that even with 50 steps, we don't even get 1 decimal place accuracy for this problem, not with any of the possible methods. (The answer is just over 64 square units.)
Remember 300 years ago, they had to do these calculations by hand! No wonder they were keen to develop aids for calculation, like logarithms.
What's Missing?
1. The most accurate numerical integration method is missing from the list above. Instead of using straight lines to connect points on the graph (the trapezoid approach), we could approximate the curve by a series of parabolas (one for each division). This gives us Simpson's Rule.
2. The integral only gives us the area if the curve is completely above the x-axis (as in each of my examples above). You need to use absolute value of the integral for the parts of the curve below the x-axis. For more detail, see Area under curves.
Summary
This article showed you an important concept in calculus. The area under a curve can represent the solution for many "real life" problems, from finding velocities to volumes.
The way it was done before calculus was developed was to use a numerical approach where we add up the areas of very thin rectangles (or trapezoids) to get a good approximation.
We get a better approximation by taking even more rectangles.
See the 18 Comments below.

27 Jun 2010 at 11:52 am [Comment permalink]
This explanation was very concise and easy to understand. Since I'll be taking Calculus this Fall, I'm sure this concept will be quite helpful. Thanks!
8 Jul 2010 at 9:57 pm [Comment permalink]
The first thing I have to express my thousands of thanks which will not be adequate for the clear explanation given for simple basic terms.
I have cleared the long confusion about the idea of using integration.
10 Jul 2010 at 8:39 am [Comment permalink]
Thanks for your comments, Suvinthra. Glad you found it useful!
23 Jul 2010 at 4:00 pm [Comment permalink]
Once again, for me (a secondary school teacher), all material on this site very useful. For that purpose, can be provided the facility to download it in pdf file format? Thank you!
24 Jul 2010 at 10:49 am [Comment permalink]
Hi Kalakay. I'm glad you find squareCircleZ useful.
It's in the plan to provide a PDF download option, but due to lack of time, this will not be for a while.
9 Aug 2010 at 12:32 am [Comment permalink]
[...] Bourne has a very clear explanation about the concept of Riemann sums posted at [...]
9 Aug 2010 at 10:25 am [Comment permalink]
Hi,
A question: If the integral of y= 0.3*x^3 *sin(x) could not be solved algebraically, as you have said, by what means was the "Actual area" field on the interactive graphs calculated?
Thanks,
-Tom
9 Aug 2010 at 11:25 am [Comment permalink]
Also, I take issue with declaring Simpson's rule to be "The most accurate numerical integration method". What about Gaussian Quadrature?
Quadrature_rules_based_on_interpolating_functions
10 Aug 2010 at 9:18 am [Comment permalink]
Hi Tom. My "actual area" uses the "middle" rectangle values with n=1000 (working in the background). This is accurate to the 3 decimal places shown in the interactive.
As for your second point, Simpson's Rule is one instance of the quadrature rules you mentioned and would certainly be adequate for 3 decimal place accuracy in this instance.
Actually, that sentence was more a "note to self" to revise this at some later point so it is more sophisticated. However, it already consumed a lot of time so I went ahead and published as is.
Thanks for your input.
17 Aug 2010 at 1:19 am [Comment permalink]
A very nice introduction into definite integrals. Thank you.
I have just one remark, viz., that the expression "area under the graph" applies only to positive functions. In principle, a definite integral can be zero for a nonzero function as, for example the integral of sin(x) over an interval of length 2π.
I have an interactive demonstration of Riemann sums where a function is defined with cubic splines and is therefore very modifiable. In addition, there are several ways of choosing the function value in each of the intervals. There is very little explanation there and your blog post will fit right in.
17 Aug 2010 at 9:03 am [Comment permalink]
Hi Alexander - good to see you here.
Yes, in the interests of trying to keep it simple, I didn't go into the issue of positive and negative integral values. However, I have modified the post (under "What's missing?") because you're right - it should be there!
17 Aug 2010 at 12:12 pm [Comment permalink]
Hi Murray,
You certainly have a nack for making things simple and clear and also for keeping up with various web developments. JSXGraph is a little wonder in itself.
23 Oct 2010 at 9:03 pm [Comment permalink]
Hi Murray!
Thank your for sharing! you did a fantastic job! your explanations are clear and purposeful. 🙂 Actually, I'm a secondary school mathematics teacher, I'll definitely share your site with my students. 🙂 Nevertheless, I'm thinking of using the interactive javascript graph that you used to explain Riemann Sums in my lesson, is there any way I can get it? Hope you can help. 🙂
Once again thank you! and hope you have a great day ahead!
24 Oct 2010 at 10:36 am [Comment permalink]
Hello Miss Lipz. Glad you found it useful.
You can simply access this page during your lesson and interact with it there. Or do you mean you don't have internet access in your classroom?
19 Jul 2011 at 5:29 pm [Comment permalink]
Thank you for your explanation. Why some calculus books made it difficult? 😀
7 Aug 2011 at 9:22 pm [Comment permalink]
I have found the explanation good.Now I have a clear understanding on how to find the area using Riemann's sum.
8 Mar 2016 at 2:48 am [Comment permalink]
Wow my math teacher's name is Colleen and she showed us this REALLY COOL WEBSITE! I am so excited to play on the website all weekend and learn more about integrals.
13 Mar 2016 at 5:59 pm [Comment permalink]
Hi Shiva and Sbusiso: I'm glad you found it useful.