Who lives there? Visual stats and social engineering
By Murray Bourne, 10 Jan 2011
This is a fascinating representation of where the various races live in the USA.
Mapping America: Every City, Every Block, by the New York Times.
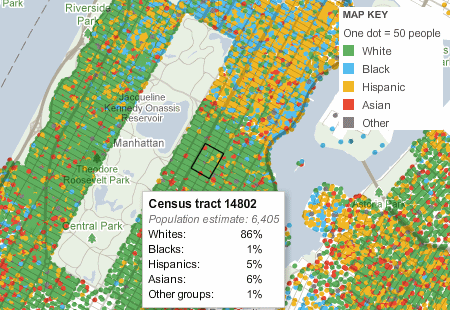
The real estate in the area around Central Park in New York is very expensive. This sector is predominately white. (The statistics refer to the block surrounded by a black rectangle).
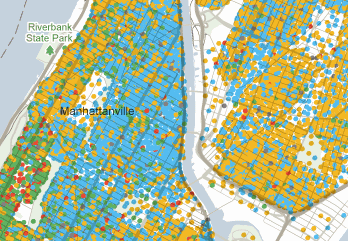
The Bronx, north of Manhattan, is predominately black (indicated by the light blue color).
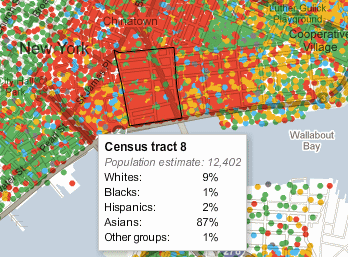
Not surprisingly,there are many Asians in the Chinatown area.
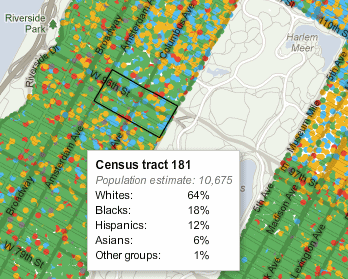
"Typical" racial mix
The US is currently around 64% white, 16% Hispanic, 12% black and 5% Asian. I managed to find one census tract where the racial mix was close to these typical values. Here it is , on the West side of Central Park:
"Even" racial mix
For interest, I went looking for a place in the USA where there was a reasonably even racial mix (that is, the same percent for each race). This is not so easy, because when you zoom to city block size, most are homogenous.
But I did manage to find one area - Alameda County, in San Francisco, where there was at least a reasonably even mix of the various races.
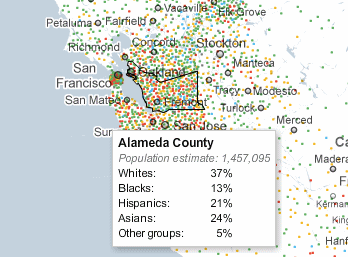
Note: Of course, "race" is a social construct and almost impossible to define, so there are many gray areas with such statistics. (See 2010 Census for more on this issue.)
Why does racial mix matter?
Most countries have had unpleasant episodes where racial intolerance has ruled the agenda. Singapore is no exception, with violent race riots in the 1950s and 1960s.
As a result, the Singapore government is keen to keep racial tensions low. They mandated that the proportion of different races living in public housing reflects the population in general.
So each apartment block (and district) has a racial mix approximately the same as the overall population (which is around 75% Chinese, 13% Malay, 9% Indians and 3% "others").
When you want to buy a public flat, your eligibility is based on the current mix in the block. So, for example, if the proportion of Malays is too low, the flat can only be sold to a Malay.
The idea behind this is if people need to live side by side, they get to know each other better, they share the same problems and understand where each other is coming from better.
And basically, it works. Racial tensions are low, people do live together (they may not love each other - "tolerate" is probably a better word) and you feel comfortable walking around, not worried that someone will hurl some racial taunt at you.
I haven't come across a map of Singapore showing races in each suburb, but it doesn't take much to imagine what it would look like. There would be around 75% Chinese, 13% Malay, 9% Indians and 3% others.
Social engineering? Yes.
But for a worthy outcome? Also, yes.
[Hat tip to gasstationwithoutpumps for alerting me to the NY Times maps.]
See the 4 Comments below.
